
Generates visualization plots for results produced by
sg_globalsens_sim(). Supported visualizations:
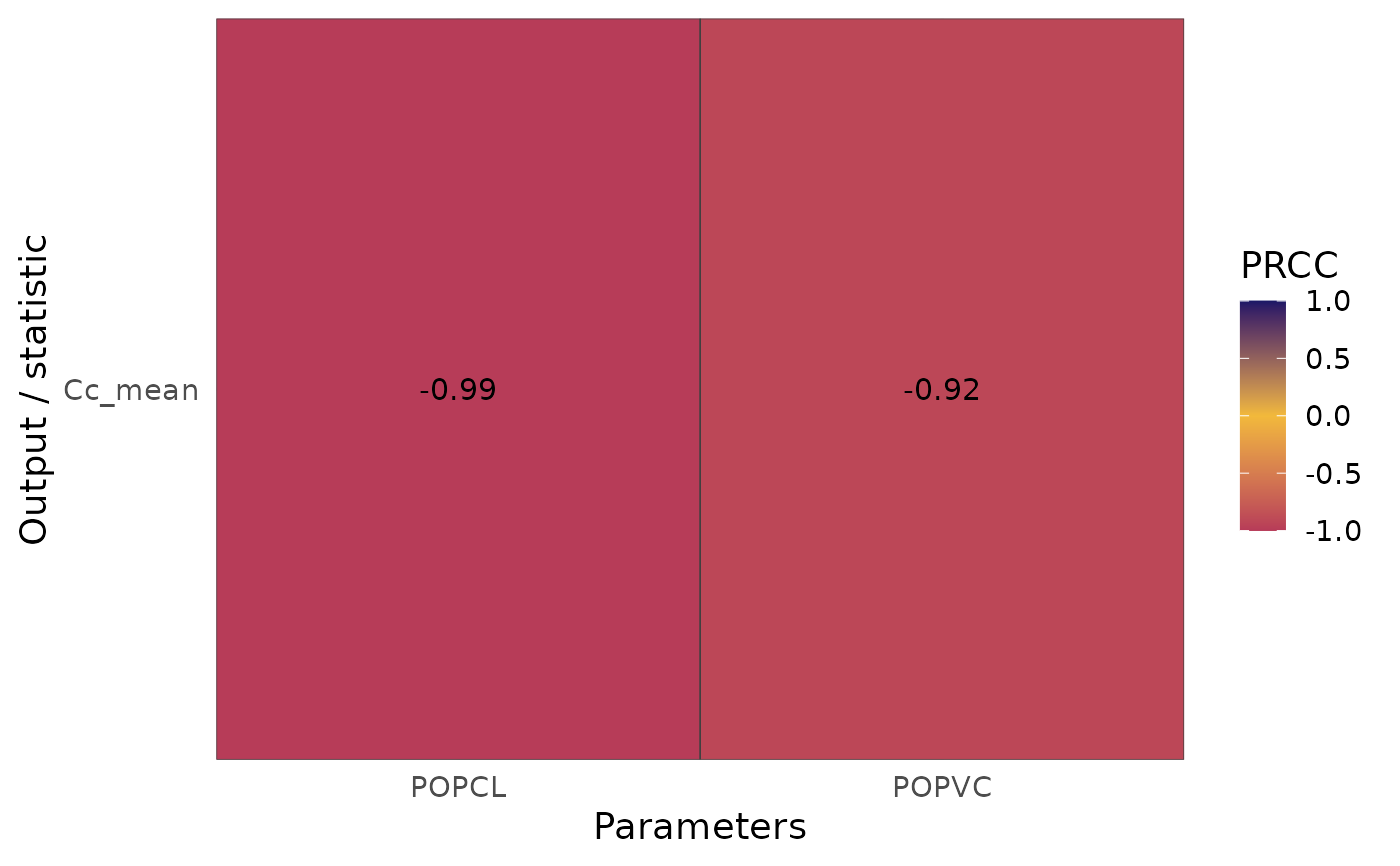
PRCC: heatmap or barplot
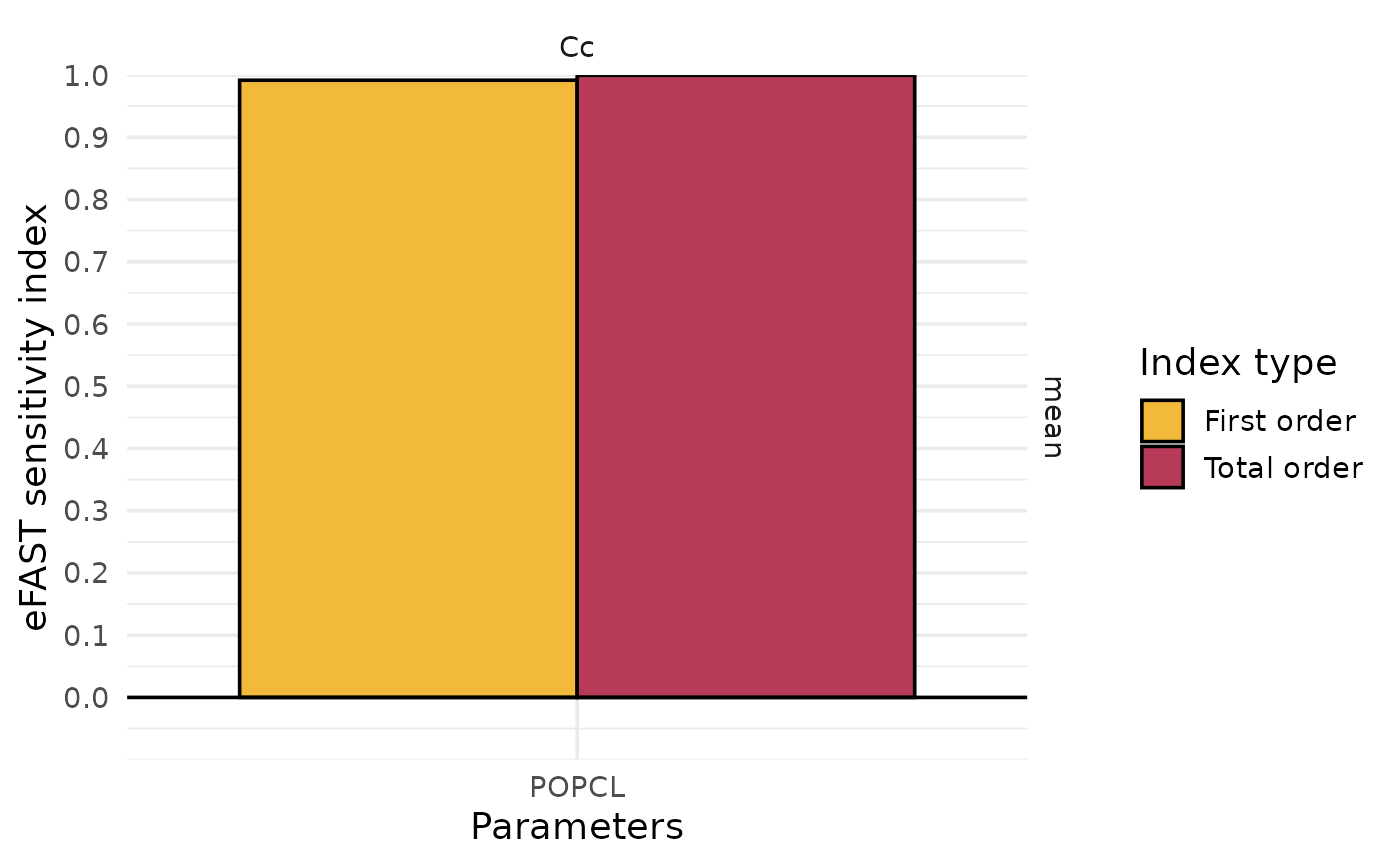
eFAST: barplot of first and total order indices
Usage
sg_globalsens_vis(
  x,
  type = c("heatmap", "bar"),
  params = NULL,
  vars = NULL,
  stats = NULL
)
Arguments
- x
Result object returned by
sg_globalsens_sim()- type
Plot type for PRCC:
"heatmap"or"bar"- params
Optional vector of parameters to display
- vars
Optional vector of output variables
- stats
Optional vector of statistics to display
Examples
# \donttest{
# Example model
library(rxode2)
library(tibble)
source(system.file("extdata", "RxODE_model", "example_rxode_model.R", package = "SimuRg")) # mod_ex
#>
#>
# Set up event table
et_base <- tribble(
~id, ~time, ~evid, ~cmt, ~amt, ~addl, ~ii, ~IGFR, ~POPN,
1, 0, 1, 1, 10, 2, 24, 112, 1
)
# Define parameter bounds
inits <- rxInits(mod_ex)
par_bounds <- tibble::tibble(
PAR = c("POPCL", "POPVC"),
LB = inits[c("POPCL", "POPVC")] * (1 - 0.9),
UB = inits[c("POPCL", "POPVC")] * (1 + 0.9)
)
# Run eFAST sensitivity analysis
res_efast <- sg_globalsens_sim(
method = c("eFAST"),
model = mod_ex,
params = c("POPCL"),
par_bounds = par_bounds,
n_sim = 100,
stimes = seq(0, 168, 10),
output = "Cc",
cov = c("IGFR", "POPN"),
et = et_base,
stat_comp = c("mean")
)
efast_p <- sg_globalsens_vis(
res_efast,
params = c("POPCL"),
vars = "Cc",
stats = c("mean")
)
efast_p
 # Run PRCC sensitivity analysis
res_prcc <- sg_globalsens_sim(
method = c("PRCC"),
model = mod_ex,
params = c("POPCL", "POPVC"),
par_bounds = par_bounds,
n_sim = 100,
stimes = seq(0, 168, 10),
output = "Cc",
cov = c("IGFR", "POPN"),
et = et_base,
stat_comp = c("mean")
)
prcc_p <- sg_globalsens_vis(
res_prcc,
type = c("heatmap"),
params = c("POPCL", "POPVC"),
vars = "Cc",
stats = c("mean")
)
prcc_p
# Run PRCC sensitivity analysis
res_prcc <- sg_globalsens_sim(
method = c("PRCC"),
model = mod_ex,
params = c("POPCL", "POPVC"),
par_bounds = par_bounds,
n_sim = 100,
stimes = seq(0, 168, 10),
output = "Cc",
cov = c("IGFR", "POPN"),
et = et_base,
stat_comp = c("mean")
)
prcc_p <- sg_globalsens_vis(
res_prcc,
type = c("heatmap"),
params = c("POPCL", "POPVC"),
vars = "Cc",
stats = c("mean")
)
prcc_p
 # }
# }