
Plot random effects or individual parameters vs covariates
Source:R/sg-gof-par-cov.R
sg_gof_par_cov.RdGenerates ggplot2 visualizations for either random effects (RE) or individual parameters (IndPar) versus continuous or categorical covariates from a GFO.
Arguments
- fpath_i
String, GFO, or a named list with a
GFOcomponent (and optionallyGCO). If a string is given, the path to a.RDataor.jsonfile with a fit object is expected.- ptype
Character. Type of plot:
"REvsCov"for random effects or"IndParvsCov"for individual parameters.- cat_cov
Optional tibble with categorical covariates. Must have columns
COVand optionallyCOVNAMEfor labels.- cont_cov
Optional tibble with continuous covariates. Must have columns
COVand optionallyCOVNAMEfor labels.
Value
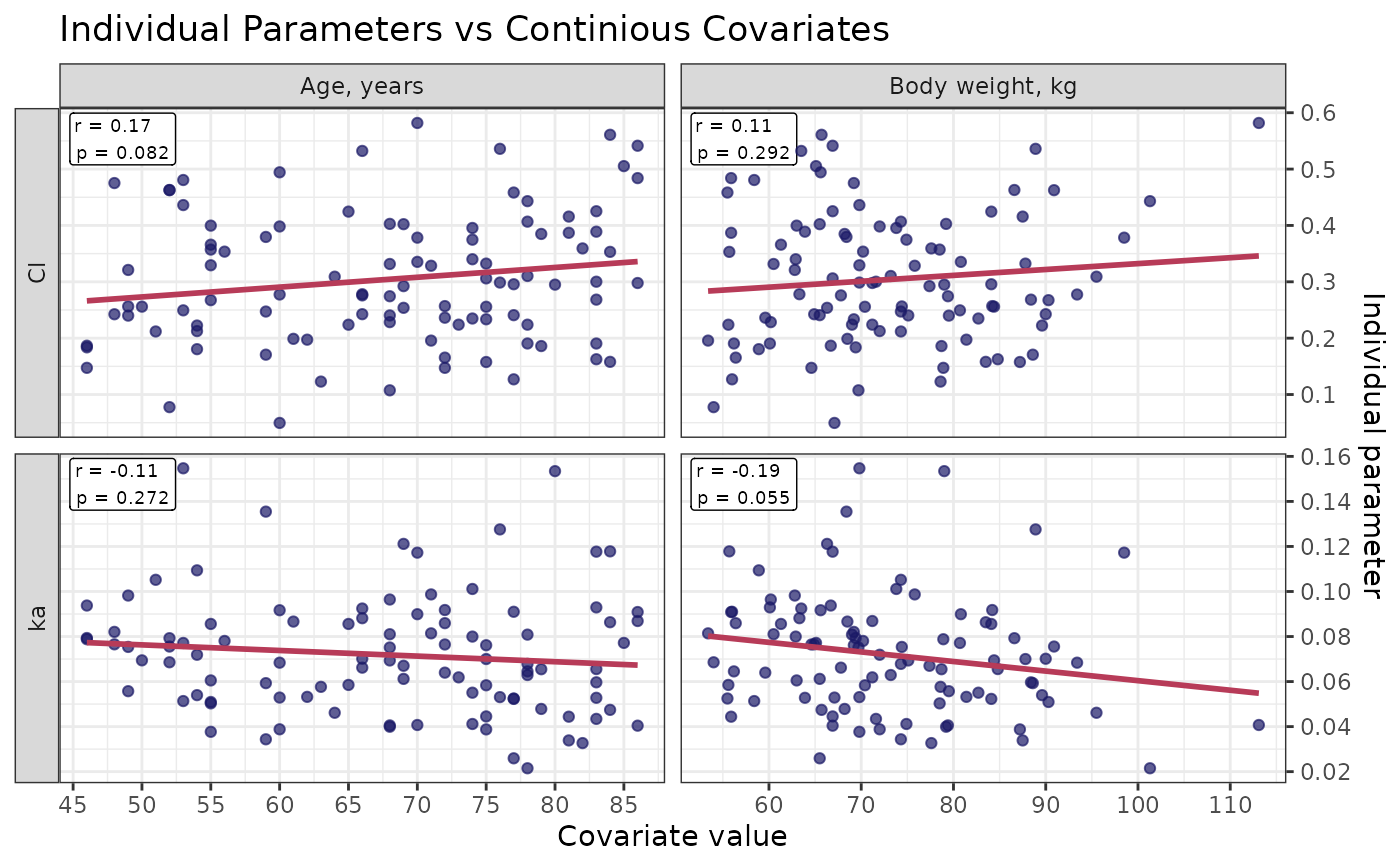
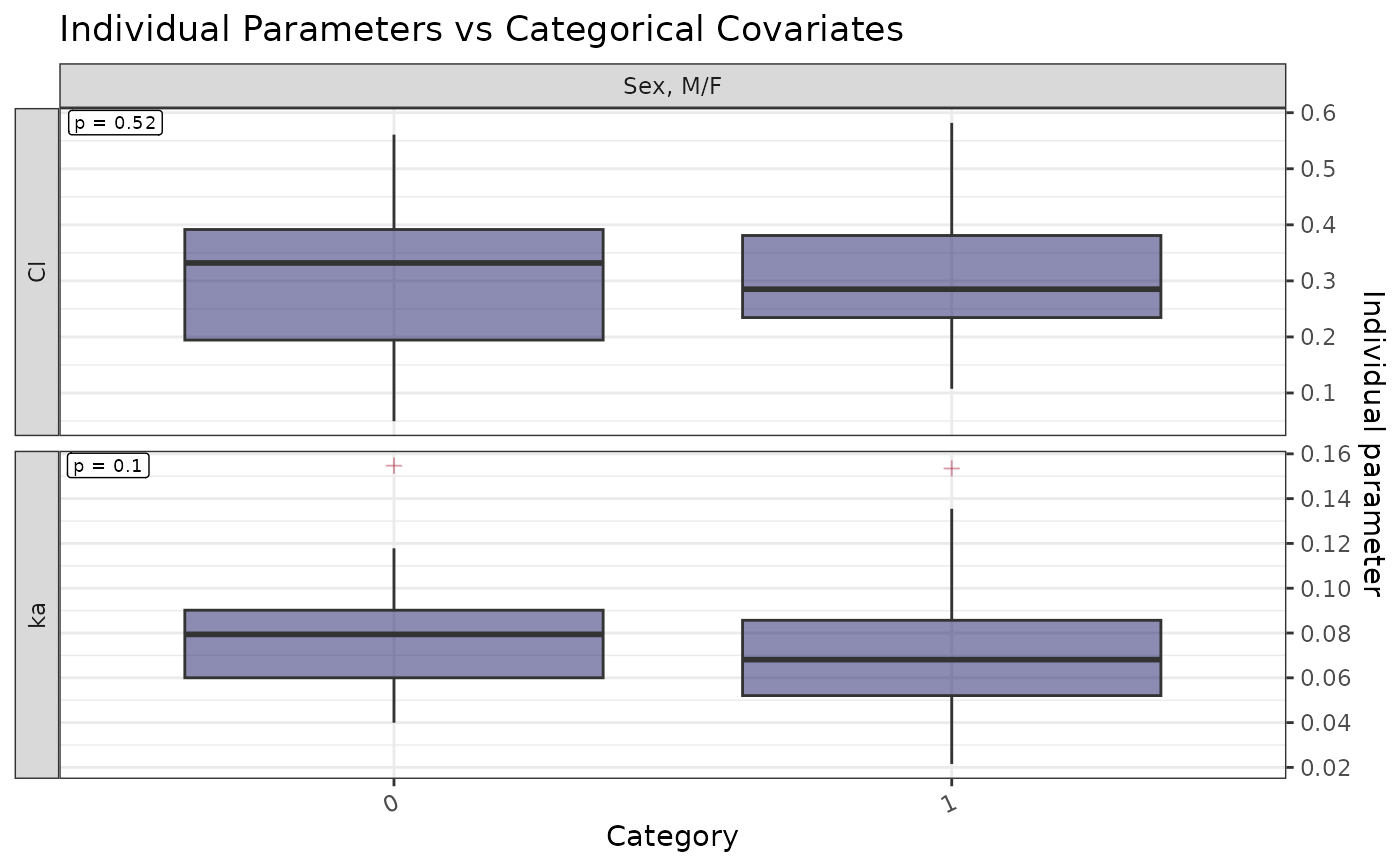
A list of ggplot objects. Returns versus continious covariates
vs_contcov and versus categorical covariates vs_catcov plots.
Examples
# \donttest{
library(tibble)
cont_cov <- tibble(
COV = c("AGE", "WEIGHT"),
COVNAME = c("Age, years", "Body weight, kg")
)
cat_cov <- tibble(
COV = c("SEX", "VKORC1_gentyp"),
COVNAME = c("Sex, M/F", "VKORC1 genotype")
)
fpath_i <- system.file("extdata", "simurg_object", "Warfarin_PK.RData", package = "SimuRg")
p <- sg_gof_par_cov(
fpath_i = fpath_i,
ptype = "IndParvsCov",
cont_cov = cont_cov,
cat_cov = cat_cov
)
p$vs_contcov
 p$vs_catcov
 # }
# }