
Plot distribution or QQ-plot of residuals from NONMEM/Simurg run
Source:R/sg-gof-res-dist.R
sg_gof_res_dist.RdThis function visualizes residuals from GFO $SDTAB. The residuals can be plotted either as
histograms with overlaid normal density curves, or as QQ-plots to assess
normality.
Usage
sg_gof_res_dist(
  fpath_i,
  res_type = "RES",
  DVID = 1,
  n_bins = 30,
  ndist = TRUE,
  plot_type = "DIST"
)
Arguments
- fpath_i
String, GFO, or a named list with a
GFOcomponent (and optionallyGCO). If a string is given, the path to a.RDataor.jsonfile with a fit object is expected.- res_type
Character vector. One or several types of residuals to plot. Values must correspond to column name(s) in
smrg_obj$SDTAB, e.g."RES","IWRES","IRES". If multiple residual types are provided, plots will be generated for each of them.- DVID
Restrict
SDTABto one observation type. Numeric values select theDVIDcolumn (default1). IfSDTABhasDVNAME, a character or factor is matched toDVNAMEfirst; otherwise a digit-only string is coerced to numericDVID.- n_bins
Integer. Number of bins to use in the histogram. Default is 30.
- ndist
Logical. If
TRUE, overlays the corresponding normal density curve on the histogram (default: TRUE).- plot_type
Character. Type of plot to produce:
"DIST"(default) - histogram of individual parameters,"QQ"- QQ-plot of individual parameters.
Examples
# \donttest{
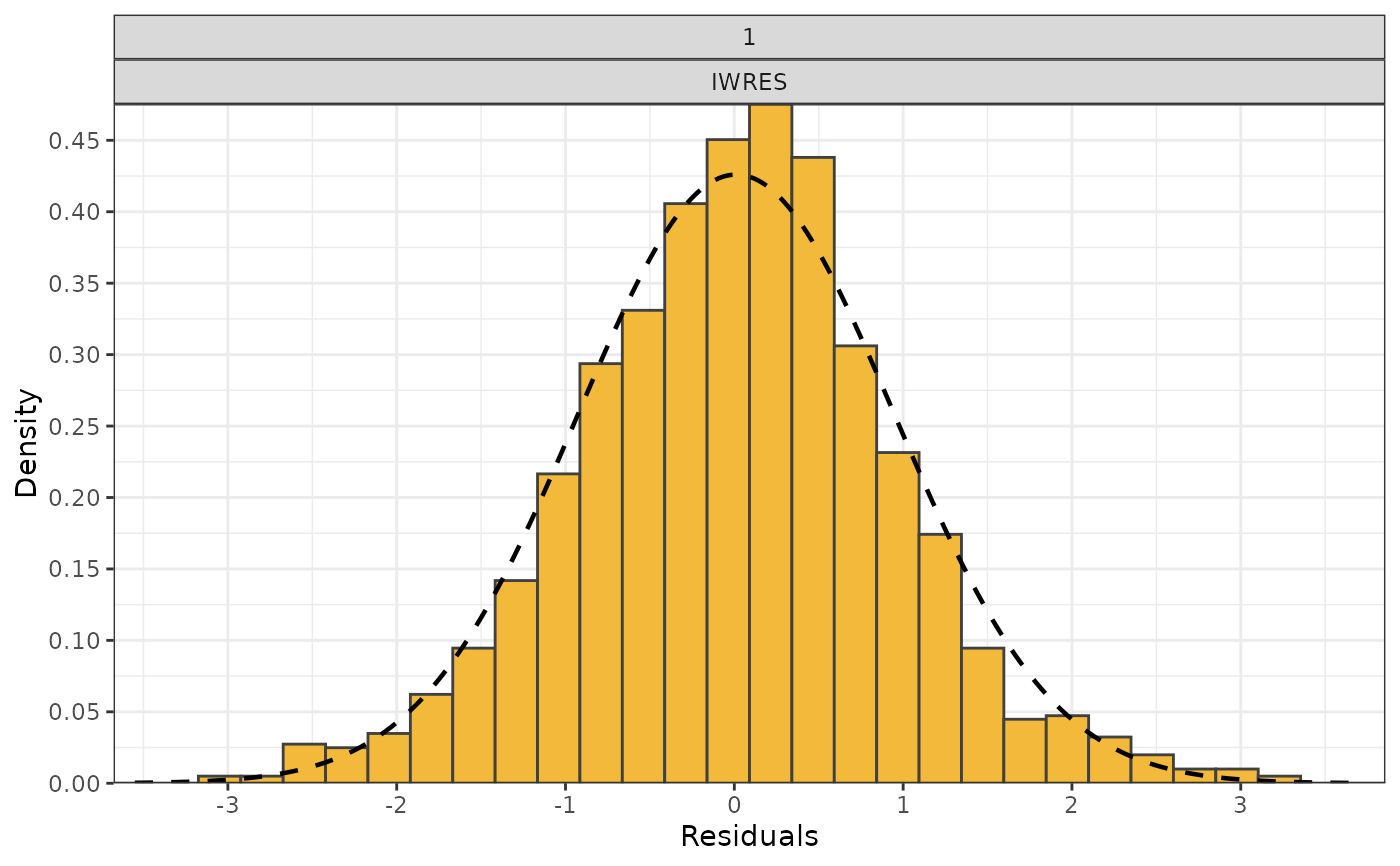
# Plot the distribution of individual weighted residuals (IWRES)
# (default \code{DVID = 1}; pass \code{DVID} or a \code{DVNAME} string to select another endpoint)
fpath_i <- system.file("extdata", "simurg_object", "Warfarin_PK.RData",
package = "SimuRg")
p <- sg_gof_res_dist(fpath_i = fpath_i, res_type = "IWRES")
p
#> Warning: The dot-dot notation (`..density..`) was deprecated in ggplot2 3.4.0.
#> ℹ Please use `after_stat(density)` instead.
#> ℹ The deprecated feature was likely used in the SimuRg package.
#> Please report the issue at <https://github.com/ms-decisions/SimuRg/issues>.
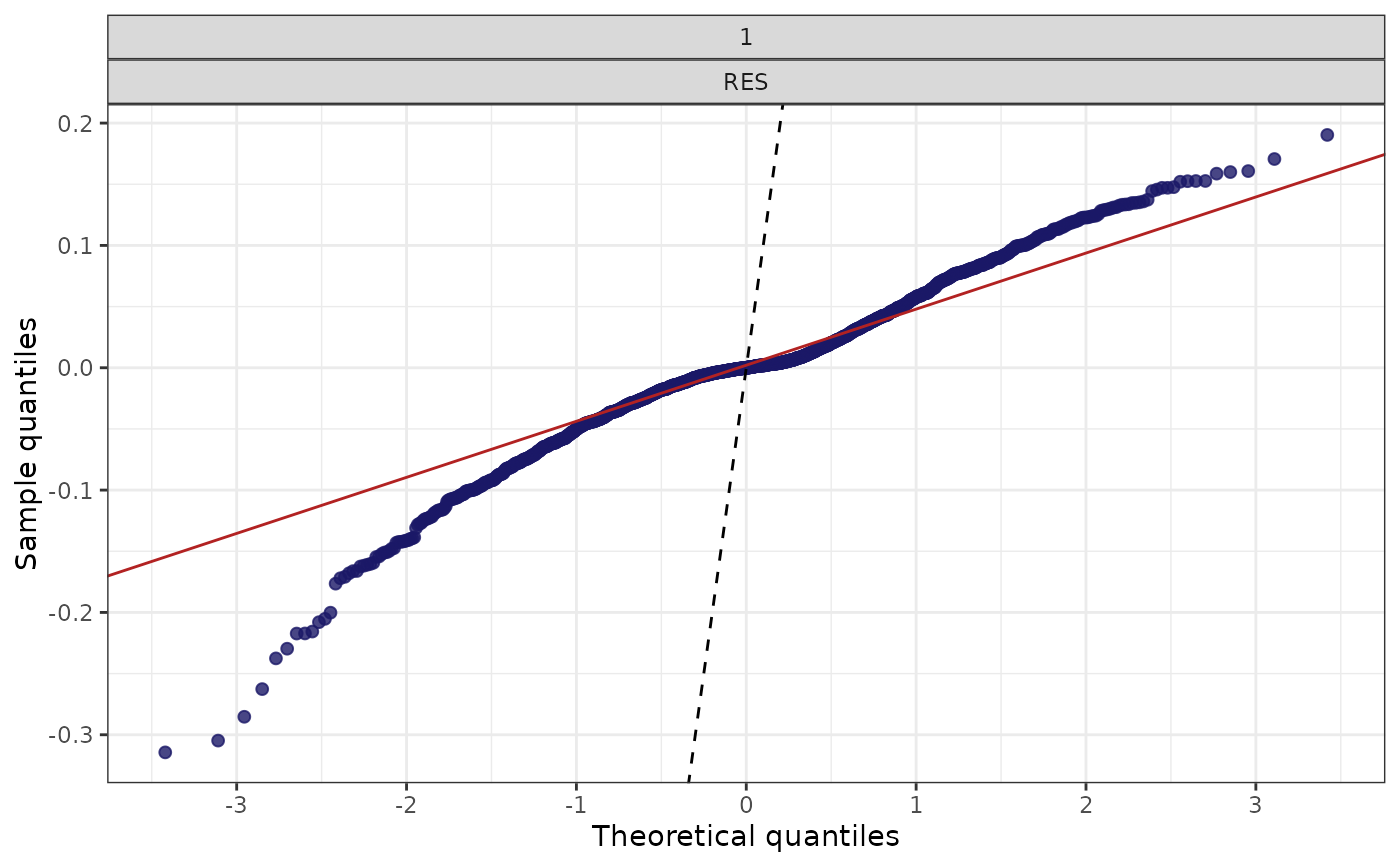
 # QQ-plots for the same default endpoint
p <- sg_gof_res_dist(fpath_i = fpath_i, res_type = "RES", plot_type = "QQ")
p
# QQ-plots for the same default endpoint
p <- sg_gof_res_dist(fpath_i = fpath_i, res_type = "RES", plot_type = "QQ")
p
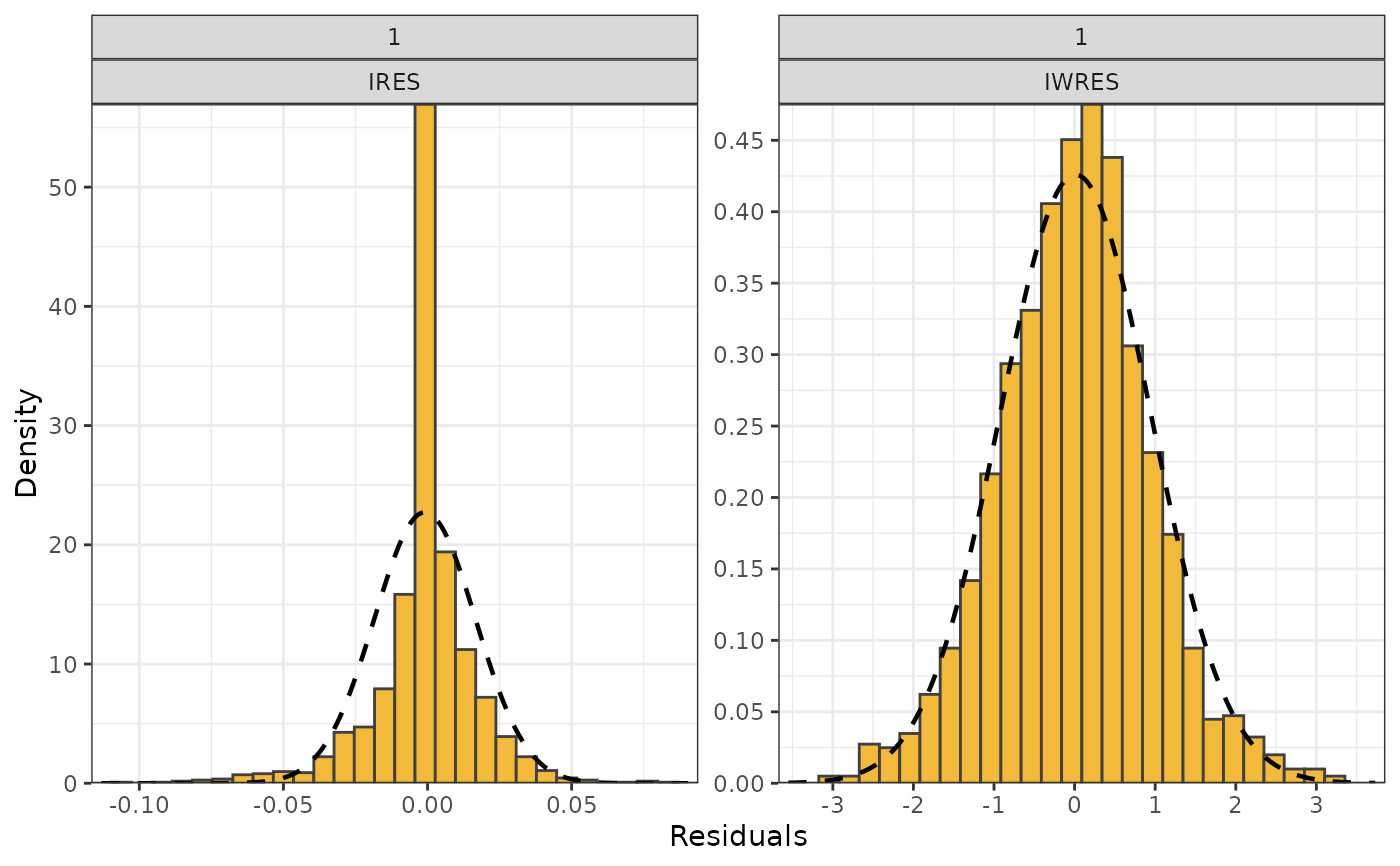
 # Several residual columns at once (still one \code{DVID} unless you change it)
p <- sg_gof_res_dist(fpath_i = fpath_i, res_type = c("IWRES", "IRES"))
p
# Several residual columns at once (still one \code{DVID} unless you change it)
p <- sg_gof_res_dist(fpath_i = fpath_i, res_type = c("IWRES", "IRES"))
p
 # }
# }