
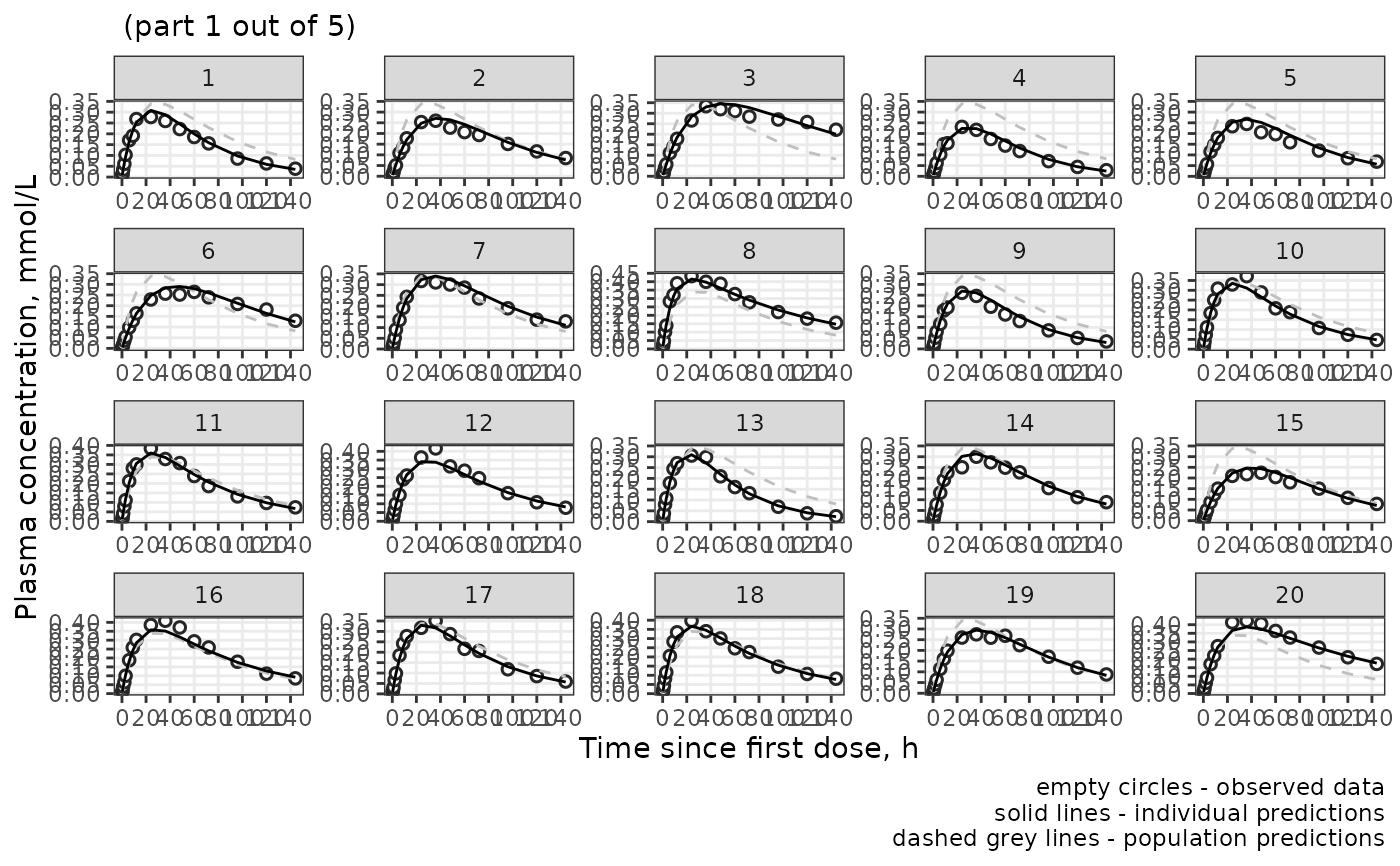
Plot time profiles of observed and predicted values from GFO $SDTAB.
Source: R/sg-gof-tp.R
sg_gof_tp.RdPlot time profiles of observed and predicted values from GFO $SDTAB.
Usage
sg_gof_tp(
  fpath_i,
  pop = TRUE,
  filt = "T",
  cov_cols = NULL,
  col_i = NULL,
  DVID = 1,
  tsld = FALSE,
  f_scales = "free",
  sort_by = NULL,
  desc = FALSE,
  log_y = FALSE,
  lab_x = "Time since first dose, h",
  lab_y = "Plasma concentration, mmol/L",
  cap = str_c("empty circles - observed data\n", "solid lines - ",
    "individual predictions\n", "dashed grey lines ", "- population predictions"),
  n_quantiles = 3,
  levels_discrete = 10
)
Arguments
- fpath_i
String, GFO, or a named list with a
GFOcomponent (and optionallyGCO). If a string is given, the path to a.RDataor.jsonfile with a fit object is expected.- pop
Logical. If
TRUE(default), adds population predictions (PRED) as dashed lines and points.- filt
String. Provide a filter to apply. Default is
"T"- cov_cols
A character vector specifying the names of the columns with covariates.
- col_i
String. Column name for color
- DVID
Restrict
SDTABto one observation type. Numeric values select theDVIDcolumn (default1). IfSDTABhasDVNAME, a character or factor is matched toDVNAMEfirst; otherwise a digit-only string is coerced to numericDVID.- tsld
Logical. If
TRUE, uses time since last dose instead of time from first dose. Default isFALSE.- f_scales
String, one of
"fixed","free","free_x","free_y". User can specify whether the scales (x and y axes) should be fixed across all panels ("fixed"), free for each panel ("free"), or free only in one dimension ("free_x"or"free_y"). Default is"fixed"- sort_by
Character vector of column names to sort ID facets by. Use "DOSE" to sort by last dose. Other names (e.g. covariates) must exist in GFO.
- desc
Logical. If TRUE, sort in descending order for all columns in
sort_by.- log_y
Logical. If
TRUE, a logarithmic scale is applied to y-axis. Default isFALSE.- lab_x
String. X-ax label. Default is "Time since first dose, h"
- lab_y
String. Y-ax label. Default is "Plasma concentration, mmol/L"
- cap
String. Plot caption. Default is "empty circles - observed data solid lines - individual predictions dashed grey lines - population predictions"
- n_quantiles
Integer. Number of quantile groups for continuous variables in
col_i. Default is 3.- levels_discrete
Integer. Maximum unique values to consider a variable discrete. Default is 10.
Examples
# \donttest{
fpath_i <- system.file("extdata", "simurg_object", "Warfarin_PK.RData",
package = "SimuRg")
plot_list <- sg_gof_tp(fpath_i)
plot_list[[1]]
 # }
# }